ReluxAnalyse+
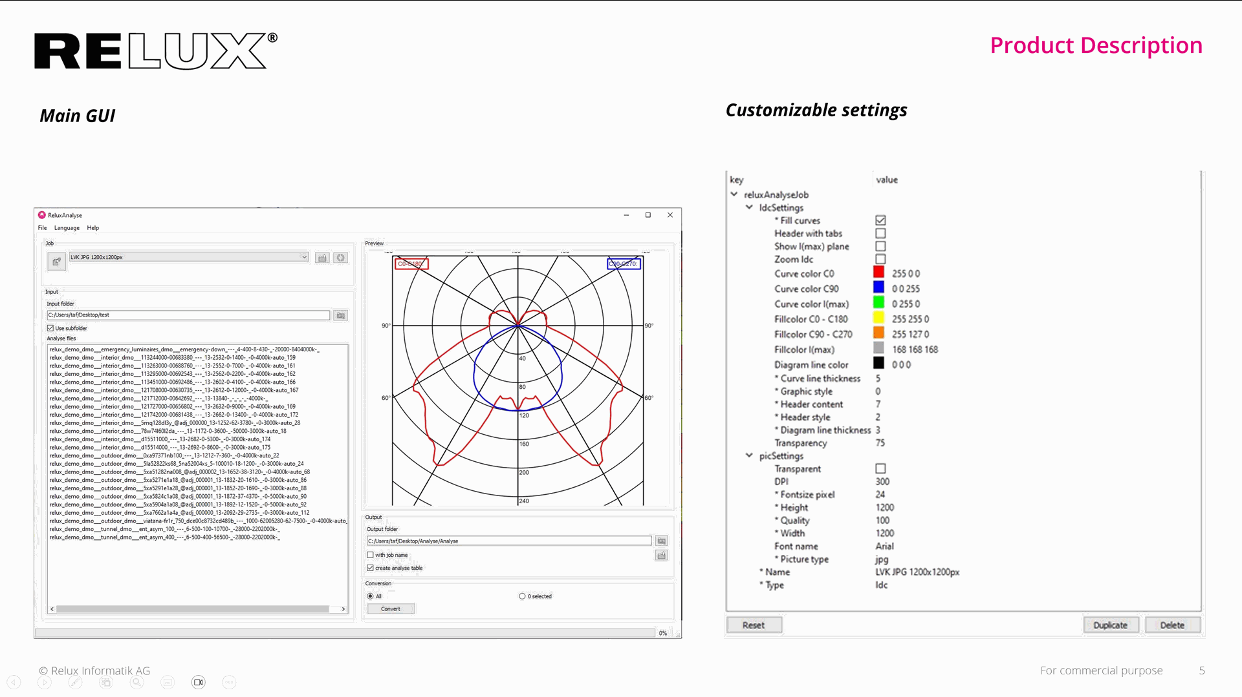
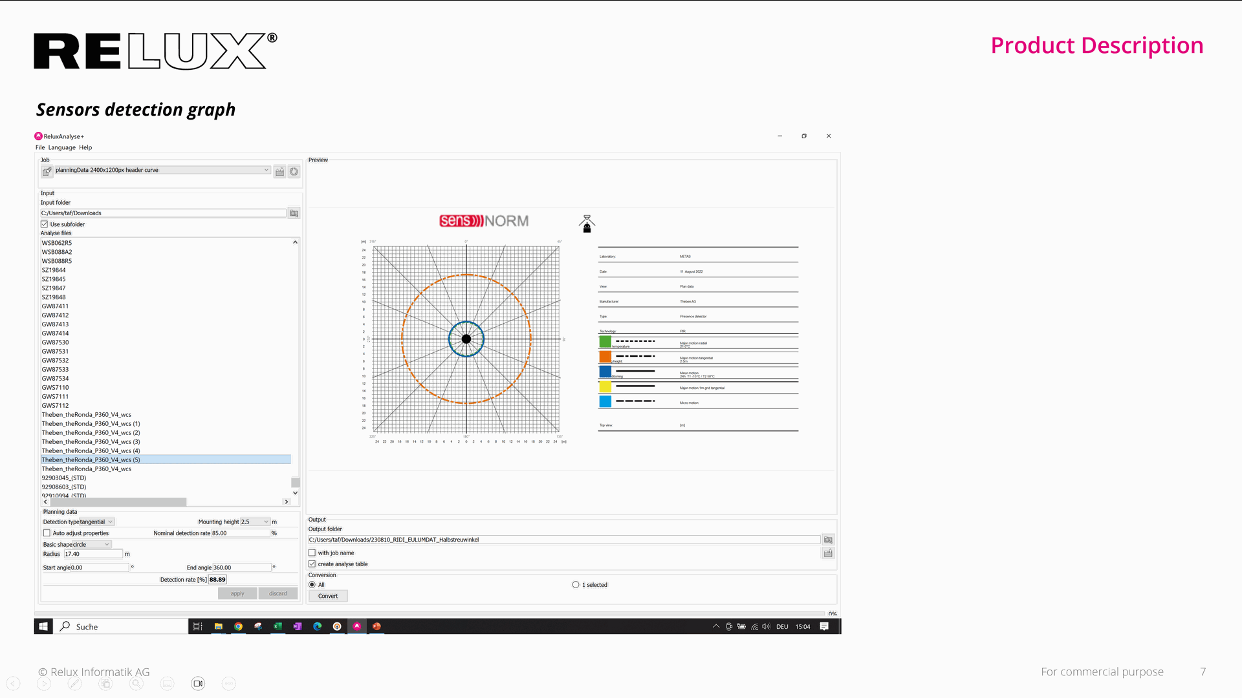
This web and desktop application reads measurement data from luminaires (LDT) and sensors (sensNORM-IEC63180) which generates various graphs and tables containing extensive information.
Download the demo version:
Extract more from your measurement data!
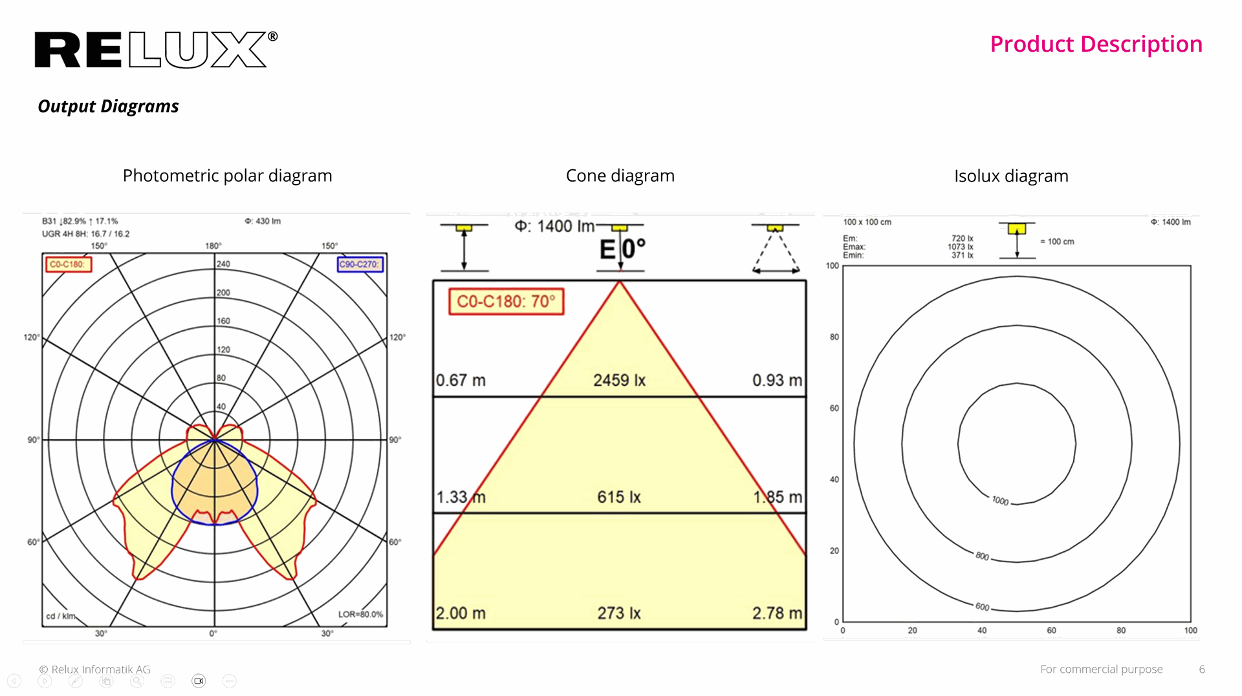
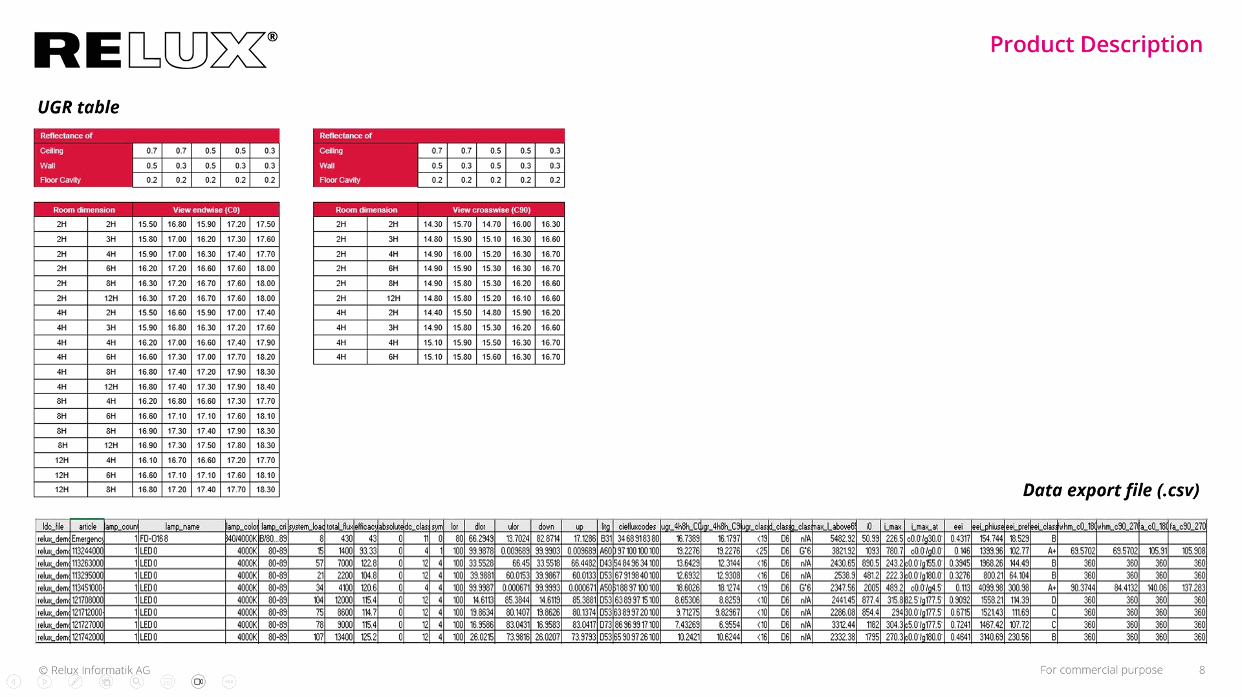
ReluxAnalyse+ is a robust web and desktop software that processes LDTs and SensXML files to generate various graphical outputs, including photometric polar diagrams, cone diagrams, isolux diagrams, and sensor detection fields. The software also provides data outputs such as UGR tables, angles, and classifications in CSV, HTML, or JSON formats. It features a user-friendly interface for customising graphical outputs and supports batch processing.
ReluxAnalyse+ can be operated via command line or WEB-API, facilitating integration with other Product Information Management (PIM) systems and automating the generation of graphics and data. The graphics are available in multiple file formats, such as raster or vector images, and can be saved in CMYK or RGB color modes.
Explore some samples:
Samples [.zip 8 MB]
Explore some samples:
Samples [.zip 8 MB]
Features in summary
| Interface | ReluxAnalyse+ |
| Batch process, automation |
|
| User interface batch control and preview |
|
| Command line (PIM integration) |
|
| Online web API (PIM / online integration |
|
| English / German UI, manual and support |
|
| Outputs, graphs and tables | ReluxAnalyse+ |
| LDT polar / Isolux and cone graphs |
|
| Illumination value table |
|
| UGR table |
|
| Sensor planning / raw data graph and table |
|
| Photometric analyse values |
|
| Input formats | ReluxAnalyse+ |
| LDT |
|
| SensXML |
|
| Output formats | ReluxAnalyse+ |
| BMP, JPG, PNG, PPM, XBM, SVG |
|
| PDF in RGB / CMYK |
|
ReluxAnalyse+ samples
Let's have a chat
Free presentation
Request a free presentation now and experience how easy and efficient street calculations can be.


